User manual
Version 1.0, 1 february 2009.
User manual
Version 1.0, 1 february 2009.
PLATINUM stands for Protein-Ligand ATtractions Investigation NUMerically. This web-service is designed to assist in analysis of results of molecular docking carried out by standard software packages.
The main feature of PLATINUM is calculation and investigation of spatial distribution and comparison of hydrophobic properties of interacting molecules (or molecular systems). This is done using the formalism of Molecular Hydrophobicity Potential (MHP). The result of PLATINUM is the complementarity of hydrophobic properties between ligand and receptor expressed in a quantitative way. Besides, PLATINUM provides visualization of hydrophobic properties and complementarity with receptor for selected ligands, which may be useful for more thorough analysis or for making informative pictures.
Instead of protein, any other molecule may be used as the receptor. For example, one can use PLATINUM to analyze hydrophobic interactions of a peptide (the ligand) with lipid bilayer (the receptor).
This section gives some clues to using PLATINUM in docking and scoring studies — computational approaches aimed at predicting the mutual orientation of two molecules, usually protein (receptor) and a smaller compound (ligand). The docking approach implies insertion of one of the molecules — the ligand — into the «known» 3D-structure of the receptor (Kitchen et al., 2004; Moitessier et al., 2008).
The docking process goes through a great number of poses of a ligand inside the receptor active site and finally yields results in a limited set of putative predicted orientations. During this process the quality of each new conformation and orientation of ligand is estimated with the help of a scoring function. Such scoring functions can be of different form, but usually represent a weighted combination of interaction terms such as van der Waals, electrostatic, hydrogen bonds, hydrophobic, etc., and approximate the binding free energy, assuming that the best oriented docking pose should have the highest affinity. However, no one scoring function is likely to be ideal and often the good docking solution (the one which is close enough to the native orientation) is scored improperly and vice versa. Some approaches have been proposed to overcome this problem and thus improve the predictive ability of docking methods.
Post-docking
Consensus scoring. This method utilizes a combination of different scoring functions
System-specific approach. Usually, a general-purpose scoring function cannot account for interaction patterns peculiar to a particular protein-target for ligand class under study. This can be improved by system-specific scores that could be trained on available experimental data prior to docking or scoring. For example, PLATINUM provides tools for estimation of hydrophobic and stacking interactions which may be important for docking of nucleobase-containing ligands (Pyrkov et al., 2007, Pyrkov et al., 2007a). These terms can be used to train a specific score either as a stand-alone function or in combination with other scores (that may not account for such interactions explicitly).
Apolar substancies tend to avoid contacts with polar solvent (water) by grouping with other apolar molecules. This results in effective hydrophobic (lipophilic) interaction which is recognized to play an important role in interactions of biological molecules. Despite this, the nature of the physical forces lying in the basis of hydrophobic effect remains uncertain. Many different intermolecular interactions contribute to this phenomenon: electrostatic, van-der-Waals, hydrogen-bonding, entropic effect, etc. That is why there still has not been proposed a universal quantitative approach to estimate the energetics of hydrophobic contact.
However, the importance of this effect in molecular biology has lead to development of empirical methods, which are mostly based on experimental data on partitioning of organic compounds between polar and apolar environments (see review for details: Efremov et al., 2007). One of the most popular approaches is to use the formalism of Molecular Hydrophobic Potential (MHP) a.k.a. Molecular Lipophilic Potential (MLP). The basic idea is to operate with hydrophobic/hydrophilic properties of molecules.
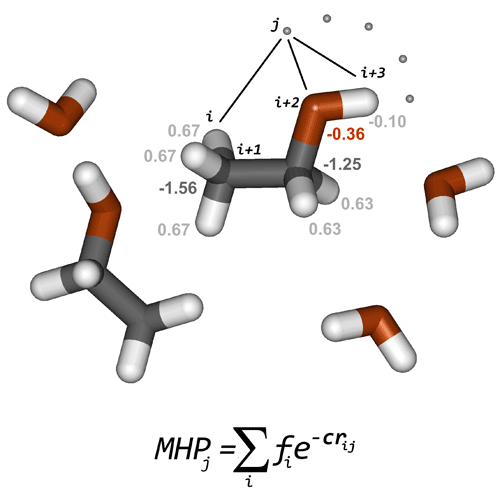
Each atom is assigned a hydrophobic (positive) or hydrophilic (negative) constant. These atomic constants are derived from experimental data. PLATINUM uses parameterization on octanol/water partition data from two sources: Ghose et al., 1998 and Viswanadhan et al., 1989. Then the hydrophobic properties can be calculated on molecular surfaces or at any point in space using a distance-dependent decay function (Fig. 2.1). Usually, exponential decay is used (Fauchere et al., 1988; Gaillard et al., 1994), however hyperbolic (Audry et al., 1986) or Fermi—like cut-off (Heiden et al., 1993) functions are also applied in some studies and are implemented in PLATINUM.
PLATINUM provides a possibility to calculate hydrophobic/hydrophilic properties of both the ligand and its environment on the ligand molecular surface (which comes here as the interface between ligand and receptor). While for ligand it is rather straightforward to calculate, some issues arise when its environment is considered. Thus, in many protein-ligand complexes there are metal ions present in the active site. The parameterizations of Ghose et al. 1998 or Viswanadhan et al., 1989 do not tell us what hydrophobicity constant they should be assigned. By default PLATINUM assignes metal ions a constant
grid step = 2 Å;
grid node hydrophilic constant
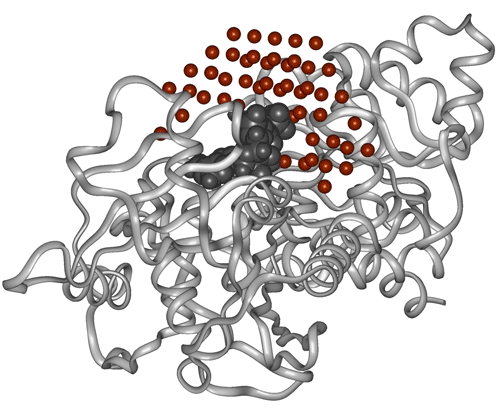
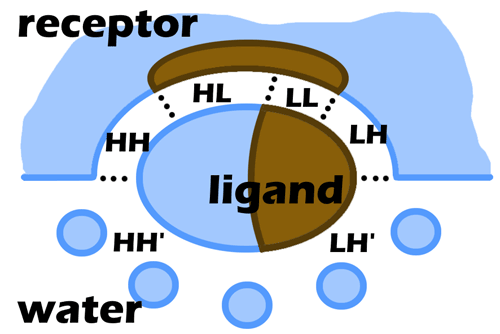
The formalism of MHP provides an excellent possibility to estimate the complementarity of hydrophobic and hydrophilic properties between receptor and ligands and thereby to estimate numerically the hydrophobic interactions. Here complementarity means that hydrophobic-hydrophobic and hydrophilic-hydrophilic receptor-ligand contacts are favorable or complementary and hydrophobic-hydrophilic contacts are anticomplementary (unfavorable). Consider for instance a ligand bound to a receptor active site. If this is a docking pose one would like to know whether it was placed correctly or not. To some extent this could be judged by the extent of favorable match of hydrophobic parts of ligand with hydrophobic areas on receptor (or hydrophlic with hydrophilic) or the extent of unfavorable mismatch when the hydrophilic areas contact with the hydrophobic ones. In PLATINUM this can be done by projecting environmental hydrophobic/hydrophilic properties (of receptor, cofactors, and solvent) onto ligand surface (interface) represented as a set of dots. When MHP is calculated, each surface dot is attributed to one of the six types (Fig. 2.3):
LL — Lipophilic ligand, Lipophilic receptor;
LH — Lipophilic ligand, Hydrophilic receptor;
LH’ — Lipophilic ligand, Hydrophilic solvent (water);
HL — Hydrophilic ligand, Lipophilic receptor;
HH — Hydrophilic ligand, Hydrophilic receptor;
HH’ — Hydrophilic ligand, Hydrophilic solvent (water).
Hereinafter, each of these codes will be used to designate the corresponding surface area (for example SLL is the area of ligand molecular surface corresponding to dots of type LL). To rank the uploaded list of complexes, the user may choose between different criteria (See section 3.3 «Scoring the results of docking»).
Besides the hydrophobic effect, there is another type of intermolecular contacts which plays distinctive role in biological recognition, but to our view it is not always paid due attention in many scoring functions, namely the interactions involving aromatic substances.
Stacking interaction can occur between two aromatic groups and results in their specific arrangement in space — usually parallel, but other variants are possible, such as «T-shaped». The most popular example is DNA where parallel stacking between nitrogen bases contributes much to the stability of a macromolecule.
However, scoring functions do not usually account for stacking explicitly. This is probably due to the possibility to simulate stacking by favorable van der Waals or electrostatic contact between two aromatic planes. Besides, this type of interactions is not as widespread as e.g.
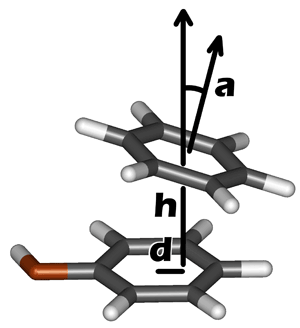
Currently, PLATINUM implements a simple method to detect a stacking contact between a ligand and a receptor based on geometrical parameters, like it may be done for hydrogen bonds (distance between donor and acceptor and angle with hydrogen atom). Stacking in PLATINUM is estimated by the following formula:
S=Sd(d)×Sh(h)×Sα(α)
where d and h are, respectively, displacement and height of the center of one aromatic ring relative to each other, and α is the angle between their planes (Fig. 2.4);
The weighting functions in the product are of the following form:
Sα(α)=max(cos2α; sin2α)
where the particular form of Sα(α) defines whether we observe parallel (cos2α ≥ 0.5) or «T-shaped» edge-to-face (sin2α > 0.5) stacking;
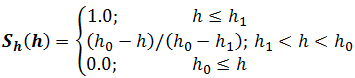
where h1 = 4.0 Å and h0 = 5.0 Å for parallel stacking and h1 = 5.0 Å and h0 = 6.0 Å for edge-to-face stacking;
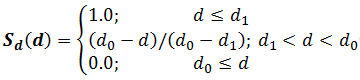
where d1 = 2.0 Å and d0 = 3.0 Å for any type of stacking arrangement. The parameters of stacking were derived from the statistical analysis of contacts of nucleobases with aromatic amino acids in proteins (Pyrkov et al., 2007).
Since each of the weighting functions lies in the range [0.0; 1.0] their product S has maximum equal to 1.0 when ideal stacking geometry is observed, and decays to zero when the stacking contact is disrupted. Conjugated ring systems (like naphtalene or purine) are treated in the following way. Consider for example stacking with aromatic side of Phe. In this case the product S will be calculated twice — for each ring of naphtalene or purine separately and then summed to yiled a resulting value (which for ideal geometry will be definitely greater than 1.0).
Also, flat guanidinium groups (which can be found in Arg side chain) are treated in the same way as aromatic rings. The rationale for that is the observation that guanidinium group of Arg tend to form parallel stacking contact with nucleobases and aromatic protein amino acids. However, the value of stacking S for contacts involving guanidinium group either from ligand or receptor will be written to a separate column, since positive charge of this fragment makes this contact different from other types of stacking.
Root-mean-square deviation (RMSD) and Tanimoto coefficient of interaction fingerprints (TcIFP) are the measures of similarity between two distinct docking poses. Using these criteria, all docking solutions can be clustered into groups to reduce redundancy or compared to the correct crystallographic structure when testing the performance of a docking algorithm.
RMSD is the most common way to compare docking poses. RMSD between poses a and b is calculated over 3D-coordinates of all N heavy atoms of ligand by the following equation:
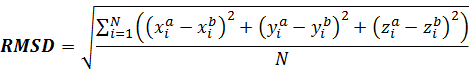
For two completely similar positions of ligand in 3D-space RMSD = 0. Usually, in docking applications RMSD ≤ 2 Å is considered acceptable, i.e. if docking yields ligand poses within this cutoff of RMSD from crystallographic (or NMR) structure for most of the reference receptor-ligand complexes it is likely to produce reliable predictions for others.
IFP represents a more complex notion and has not yet achieved wide use. The basic idea is that RMSD does not always provide complete information about the similarity of orientation of a ligand in the binding site. Thus, in some cases even low RMSD may correspond to distinctly different intermolecular contact pattern and vice versa. One way to treat this problem may be using some quantitative measure of similarity of contacts with receptor, such as hydrogen bonds, salt-bridges, etc. And IFP provides such measure.
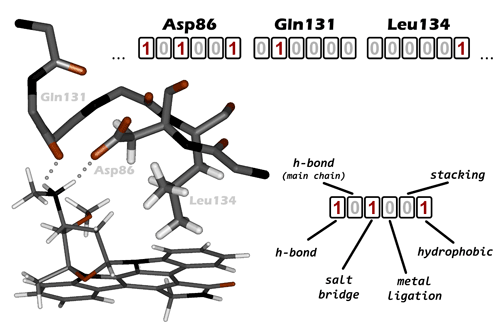
Introduced recently (Deng et al., 2004), IFP represents a conversion of 3D pattern of contacts between ligand and receptor into 1D bit string. Here, a set of bits, corresponding to different intermolecular contacts is assigned to each receptor residue in the vicinity of the ligand-binding site (Fig. 2.5; in PLATINUM these bits are different from those in the original implementation by Deng et al., 2004, see below). When a contact with a particular residue is observed, e.g. a hydrogen-bond is formed, the corresponding bit is raised. And two bit-strings coding two docking poses can be compared now indicating whether they are similar or not. To compare the strings A and B, coding two ligand poses a Tanimoto coefficient is used:
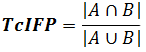
Here A∩B is the number of raised bits common to both poses, and AUB is the number of bits raised for either ligand A or B. Consequntly the value of TcIFP can vary between 0 (different poses) and 1 (identical poses).
A weak point of the IFP comes from its definition: Criteria to judge whether a contact is formed or not, are not universal. Thus, although IFP was introduced only some years ago, a number of different approaches to treat the interaction bits has already been described in literature. This is because besides such contacts as hydrogen-bond with well-defined geometrical parameters, there exist stacking or hydrophobic contacts for which different criteria may be applied. For stacking this problem can be solved to some extent by data extraction from structural databases (Pyrkov et al., 2007, Meyer et al., 2003). Meanwhile for hydrophobic interaction this task is quite more challenging since the nature of forces driving this interaction is still poorly understood. So, in PLATINUM we used our own approach to describe ligand-receptor contacts. These contacts and the rules defining their formation are listed in Table 2.1 (However later these may undergo improvement and any remarks are welcome).
Interaction bit |
rules |
comments |
h-bond |
1) rDA < 3.4 Å; 2) <ADH < 40° (or in case of -OH group: <RDA = 105° ± 20°) |
A — acceptor; D — donor; H — hydrogen; R — atom next to -OH group; |
|
|
Same + receptor is a protein molecule and its atom is named «O» or «N» in the structure file | |
|
salt-bridge |
rNP < 6Å |
N — atom with formal negative charge; P — atom with formal positive charge; |
|
metal ligation bond |
rAM < 4Å |
M — metal ion; A — ligated atom, same as acceptor |
|
stacking (including guanidinium group) |
1) d < 3Å; 2) h < 5Å and cos2α > 0.1 (for parallel stacking); 2’) h < 6Å and sin2α > 0.1 (for |
d — displacement; |
|
hydrophobic |
At least 2 recptor hydrophobic atoms are within 7Å to hydrophobic ligand atoms. |
Briefly, the workflow of PLATINUM is the following:
Step 1. Upload ligands and receptor in separate files (Section 3.1).
Step 2. Set MHP calculation parameters. Also it is possible to mark here one of the ligands as the reference to compare all the others to this one by RMSD, e.g. ligand pose taken from the
Step 3. View the results page and sort docking solutions by one of the scoring criteria. Download data in a tab-separated text file (Section 3.3).
Step 4. If desired, it is possible to view distribution of hydrophobic properties for selected «best» solutions either by downloading files with precalculated MHP data (click the floppy-disk icon  ) or in Jmol applet on the PLATINUM web server (click the molecule icon
  ).
).
Important! The results of PLATINUM calculations are stored for 30 days and are accessible via the unique uid code. To get these results press the «Goto results page» caption in the upper right corner on the PLATINUM main page. A dialog appears where the uid code should be entered. This code is sent you
The first step using PLATINUM is to upload the molecules. PLATINUM supports input in four popular molecular file formats: pdb, mol2, sdf and gro (which is used in the program package for molecular dynamics GROMACS (Berendsen et al., 1995)). Current version of PLATINUM does not provide any interactive tools for working with molecules (such as visual manipulation, addition or removal of molecules). That is when the molecules are uploaded and parameters of calculations are set, the program processes them inwardly and yields a requested result.
Any file can be uploaded as either receptor, ligand or reference ligand. Molecules in such files will be treated in different ways. Ligands are the major type of molecules for which all calculations are performed (hydrophobic properties, interactions with receptor, etc.). PLATINUM cannot work if no ligand was supplied.
Unlike that, receptor and reference ligand can be either given or not. Receptor molecule is used to calculate interactions (hydrophobic and stacking) with ligands. If no receptor molecule was provided, the calculations will be performed anyway. However, in this case the only meaningful results are those that reflect the properties of ligand molecules themselves (e.g., distribution of ligand hydrophobicity over its own surface for visualization purposes).
Besides, since the main goal of PLATINUM is to assist in analysis of results of docking, an option was added to calculate similarity of position and orientation of docking poses with
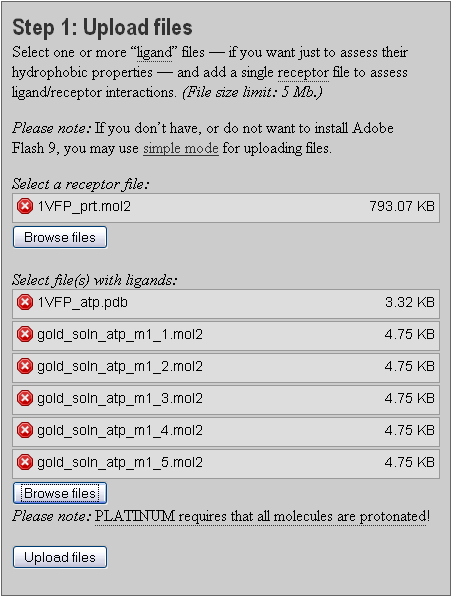
To upload files use the front panel (Fig 3.1). Here, the reference ligand should also be listed in the ligand section.
Important issues
By default PLATINUM web server uses Adobe Flash Player 9 to upload files. The old versions of some web browsers may be not compatible with Adobe Flash Player 9 and there is a possibility to upload files without using it — simply go by the reference «simple mode» on the upload files page. Also Java applet is required to be installed for
The size of the molecules is limited to 5 Mb which roughly corrsponds to a molecule of 40,000 atoms (in mol2 file) and is obviously suitable for most practical applications
Reference ligand can be selected at the next step. You can mark any one of the entries as reference — not mandatory the first one.
Any ligand file can contain more than one molecule, but this is not recommended. If a list of docking poses is provided in a single file, make sure that this is either mol2, sdf or pdb format. Otherwise, PLATINUM will not be able to reliably identify these as separate molecules and will treat all atoms in the file as a single compound. When such «multiple-ligand» file is uploaded, it is automatically splitted. Then the ligands appear in the results table with the numbers according to their ordering in the file.
The same refers to reference ligand. Besides, RMSD and IFP will be calculated using only the first reference ligand molecule. Corresponding atoms between ligands and reference ligand are defined by the atom name, the number and name of residue — if resulting RMSD and IFP values seem unreasonable, it is likely that the number or the name of residue was changed during the docking process or while preparing molecules for docking, and this should be corrected manually. Only heavy atoms are used in calculation of RMSD and IFP. RMSD will be set
Requirements to the receptor are much less strict and here any file format is generally suitable. However one should keep in mind that all molecules in this file are simultaneously used to evaluate interactions with each ligand. That is a single receptor molecule is used for all the ligands. If, for example, 10 receptor molecules were written in such file, then for each ligand the values of the interaction terms will be 10 times larger than they should be.
Remember that receptor and ligand molecules should be submitted in separate files!
This section describes the next step — setting MHP calculation parameters and launching PLATINUM. PLATINUM was designed to facilitate analysis and visualization of hydrophobic/hydrophilic properties of biological molecules. Some software packages provide tools to calculate these properties using the same formalism of MHP. However, there is often required a tool providing more flexibility of calculation.
PLATINUM provides a possibility to change some of these parameters (Fig. 3.2). Below is the list of these parameters with discussion of the effect they may exert on the final result.
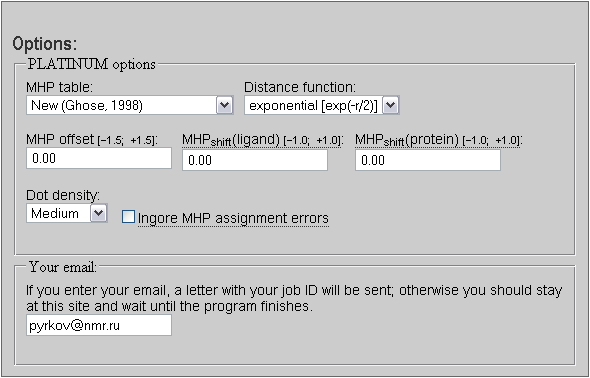 |
Figure 3.2. The MHP parameters tab. You can also provide your email address to receive URL for the results page on the PLATINUM server by mail. |
The parameterization of atomic hydrophobic/hydrophilic constants used in PLATINUM implies a full-atom model — make sure that hydrogen atoms were added prior uploading files. Two variants of this parameterization exist: The former one (Viswanadhan et al., 1989) and the upgraded (Ghose et al., 1998). The resulting picture may differ for these two parameterizations: The major changes in the new table relate more realistic negative (hydrophilic) constants for some heteroatom types, particularly oxygen. Therefore, it is recommended to use the new version, although the previous one was also kept in the program (mainly for comparison purposes). For protein residues there will be little difference, however, for low molecular weight compounds the difference between these two parameterizations may be prominent.
Since MHP is an empirical approach, no «exact» distance-dependent decay function is known (like it is for electrostatic or van der Waals energy). Several different approaches have been described in literature. The most popular is the exponential function:
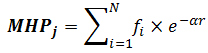
where MHPj is the hydrophobicity potential at point j, N is the number of atoms, r is the distance between point j and atom i in Å, and α has the dimension of
Alternatively, a hyperbolic function was proposed by analogy with the electrostatic potential energy. It is calculated according to the following formula (Audry et al., 1986):
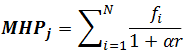
where α =
Finally, one can use averaging of atomic hydrophobicity constants in the vicinity of point j with a cut-off function smoothed as a Fermi—like potential (Heiden et al., 1993):
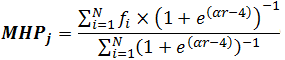
where α =
Empirical atomic hydrophobicity constants may need some correction to produce more realistic picture of distribution of molecular properties. We found that moderate shift to the more hydrophobic range improves the distribution of properties for low-molecular-weight compounds, particularly nucleosides and nucleotides (Fig. 3.3). Meanwhile, such moderate shift does not influence protein MHP greatly. So, it is recommended to use MHP offset of 0.03 logP units, which is added to each atomic hydrophobicity constant prior to any MHP calculations. User can change this value in the range
These parameters are similar to the MHP offset but allow more flexible tuning of MHP values. While the «MHP offset» adds the same constant to both the ligand and the receptor atoms, «MHP shifts» provide separate change for these molecules. The difference is that «MHP shifts» are added not to atoms, but to MHP at surface points (or grid points). However the effect of «MHP offset» = 0.5 and «MHP shift» = 0.5 is almost the same. Both «MHP shift» values can be varied in the range
This parameter does not change much the overall picture. However, higher density makes the result more robust, although it increases the elapsed time to process molecules. It is recommended to use Low or Medium density for single calculations and VeryLow or Low density for analysis of more than ~10÷100 ligand poses.
PLATINUM automatically identifies the valencies of atoms and bond orders and based on these data assigns atomic MHP constants. By default, if it fails to do so for any atom in a ligand the error message is returned and no further calculations are performed. PLATINUM is more forgiving to errors in the receptor molecule in assumption that if only a minor portion of atoms have mistakes (≥ 10) they are likely to reside far from the active site and will not influence the final result.
However if you are sure that the errors in one or even more atoms of the ligand molecule may be neglected then mark the «Ignore errors» check-box. This will force the MHP calculations anyway. This can be done e.g. when a peptidic ligand of ≥10 is not properly capped and manual correction of such mistake may become a needless routine.
After all the parameters are set (and reference ligand selected), press the button:
Then your submission is queued and as soon as PLATINUM finishes, the results page is displayed (the page will refresh every 30 seconds until PLATINUM finishes).
When PLATINUM job is done, the Results page is displayed. On this page you can see the interaction terms caculated by PLATINUM for each ligand pose (Fig. 3.4). If a reference ligand was provided there appear columns with RMSD and IFP (see Theory, Section 2.4), indicating similarity of orientation of each ligand to the reference structure.
The receptor and reference ligand names along with «There are warnings» button (click to list the warnings if any) are shown above the table.
The «Save this table in tab-delimited format» button is below the table. Clicking here saves the table in a tab-separated text file on a local disk for further analysis.
Also, you can change MHP parameters and recalculate hydrophobic properties. To do that press the «Change settings & restart» caption in the upper right corner. Or press the «Start a new task» caption to start PLATINUM from the very beginning.
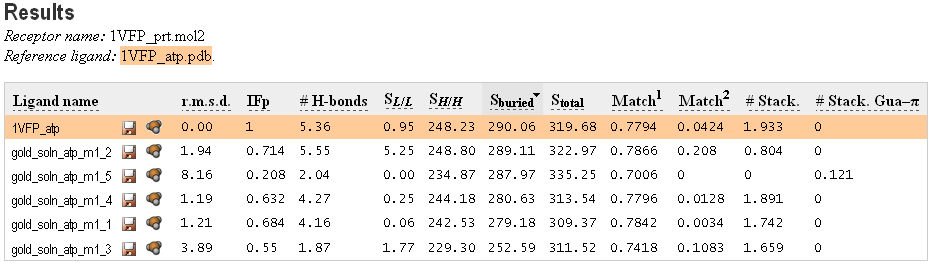 |
Figure 3.4. Interaction terms calculated by PLATINUM for ligand docking poses. Reference ligand is marked with orange color. |
Here is the explanation of the interaction terms:
Clicking on the name of each interaction term will sort the docking poses by its value. Click on «Ligand name» to restore the initial view. You can sort the list according to one of the listed terms. If any term is equal to zero for each ligand pose, it will not appear in the table.
Generally, Match1 and Match2 terms are recommended for scoring and are of similar efficiency — the choice between them might depend on the user’s preference and intuition. Other terms are given as the additional information which may be useful in some cases.
Scoring by hydrophobic complementarity SLL is recommended as default, however the user is free to inspect other variants. This term has been optimized to use with «goldscore» scoring function — for rescoring results of docking (Pyrkov et al., 2008), obtained with the program GOLD (Jones et al., 1995). This number should be simply multiplied by the factor of 0.015 and added to the corresponding goldscore value. However, this should only be done with the optimal MHP parameters for rescoring results of GOLD:
dotdensity = Low;
MHPoffset = 0.03;
MHPshift-lig = 0.6;
MHPshift-rec = 0.3;
GOLD docking program was chosen as one of the most efficient and popular tool (Kitchen et al., 2004). In future, we also plan to optimize scoring criteria for other popular docking programs.
Note, that the numbers
When the results of docking have been processed and hydrophobic complementarity calculated, one may wish to select some of them for more thorough study — e.g. seek what part of ligand may be responsible for non-optimal hydrophobic or hydrophilic contact, or analyze the overall distribution of ligand hydrophobic properties. For that purpose PLATINUM provides tools for visualization of hydrophobic/hydrophilic properties and their complementarity between ligand and receptor molecules.
One such tool is visualization in Jmol applet (www.jmol.org) on the PLATINUM web server. To use it simply click the molecule icon just next to the ligand pose you wish to view.
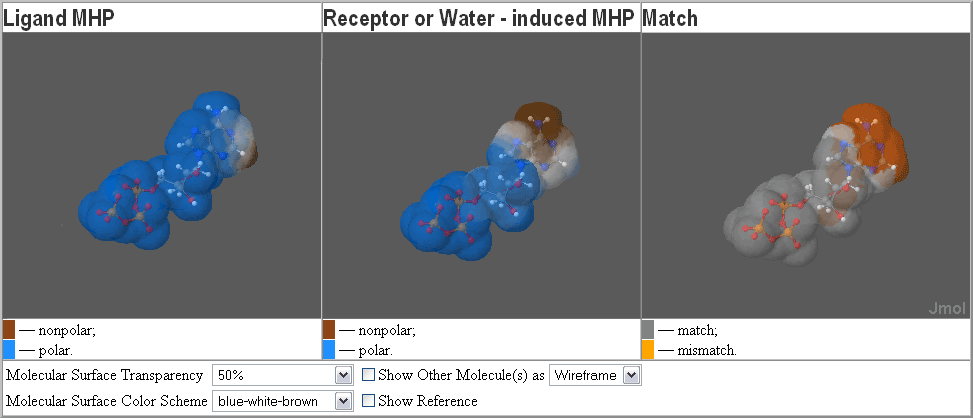
This immediately opens a new window where you can see three Jmol views of the same ligand pose in the receptor binding site. The ligand surface is colored respectively by its own MHP (left panel), MHP induced by its environment (middle panel), and complementarity of hydrophobic/hydrophilic properties between them (right panel).
Another way to view the distribution of molecular hydrophobic/hydrophilic properties is to save precalculated MHP data as files on a local disk. These files may be then loaded into a molecular visualization application for analysis, e.g. in PyMOL (DeLano, 2002; http://www.pymol.org). Also doing so you can create a nice picture or illustration of molecular hydrophobic properties and complementarity. Furthermore such data may be useful to perform private calculations of hydrophobic interactions without PLATINUM.
To use this option simply click on the floppy-disk icon just next to the ligand pose you wish to view. A menu appears where you can choose the format of output data and readjust some parameters of MHP calculation (Fig. 3.6).
You can save data in a number of different formats depending on which molecular visualizing application you prefer to use and what possibilities it provides. This section gives a brief overview of available formats. Detailed discription of output files is given in the Section 3.6 (Format of Output Files for Visualization).
 |
Figure 3.6. Menu for visualization of molecular hydrophobic/hydrophilic properties. |
Most of the MHP parameters are the same as for processing the results of docking (Section 3.2; Fig. 3.2). A new option here is the «Color scheme». Different color schemes may be used (Fig. 3.7; «Brown-Cyan» is the default). This parameter defines the colors corresponding to hydrophobic and hydrophilic parts of molecules and may affect some output data.
Besides ligand MHP one can request calculation of MHP of its environment (receptor and water). To do that mark the check-box «Calculate MHP distribution from the protein as well». Then additional file will be provided.
MHP constants. Save a table of atomic MHP constants. PLATINUM provides the possibility to facilitate assignment of these constants which otherwise would consume much effort and time to do it manually. Can be used for further private calculations.
Molecular file. Save results either to.mol2 or.pdb format. These files can be later loaded into a molecular visualizing program e.g. PyMOL and colored according to MHP data written to their occupancy and
Molecular surface. Save data either in the format of InsightII (Molecular Simulations Inc., 2000) surface or as a.pdb file as a set of «atoms».
Grid. Save data in the format of either InsightII or MolMol (Koradi et al., 1996). In both cases additional files (spectrum and scripts) will be provided to facilitate the procedure of visualizing molecular properties.
Below, each option will be described with its parameters in detail. Results for each option are written to files that should be saved on local disk. Filename conventions are the following. Let us say that visualization was requested for ligand named ligfilename.mol2 (or ligfilename.sdf, etc.). Then any file with the results of PLATINUM calculation will start with this name ligfilename_ with the appropriate suffix and extension.
Assignment of hydrophobic constants to atoms of a molecule is based on sophisticated molecular topology. For e.g. protein residues these can be easily tabulated, but when ligands are processed, manual constants assignment becomes a problem that may be much effort- and time-consuming. PLATINUM makes such assignment in an automatic way. These data may be used to perform your own calculations of MHP in case there is no appropriate option in PLATINUM. The output is a text file ligfilename_mhptab.txt. The format of a line in this file is:
Atom number | Atom name | Atom Sybyl type | Residue number | Residue name | Atom MHP type | Atom MHP constant | CVFF electrostatic charge | |||
|
ATOM |
24 |
2HH2 |
H |
1 |
ARG |
mhp= |
50 |
-0.1036 |
charge= |
0.3278 |
|
ATOM |
25 |
N |
N.am |
2 |
TRP |
mhp= |
72 |
-0.5113 |
charge= |
-0.5985 |
|
ATOM |
26 |
CA |
C.3 |
2 |
TRP |
mhp= |
8 |
-0.6805 |
charge= |
0.0100 |
|
ATOM |
27 |
C |
C.2 |
2 |
TRP |
mhp= |
36 |
-0.1320 |
charge= |
0.1668 |
This is perhaps the most universal format of output. Both.mol2 and.pdb file formats are understood by most molecular modeling software and almost always can be used to color the molecular surface by the value of electric charge (and
If you use e.g. PyMOL, then type the following command to color the molecule by MHP:
cmd.spectrum(’b’, «cyan_white_yellow», selection=’all’)
or use «green_white_yellow» or «red_white_blue» color schemes instead.
The output for tabulated atomic MHP constants is saved to files:The output for averaged surface MHP is saved to files:
These surfaces may be used to visualize molecular MHP in InsightII (special format; surface dots) or in any other molecular visualizers (surface dots written as list of «atoms» in pdb file format). The parameters of MHP calculation on surface are the same as for grids.
The output in.pdb file format is saved to files: ligfilename_mhplig.surf.pdb and ligfilename_mhprec.surf.pdb (if this option was requested). MHP values at surface dots are written to charge and
The output for InsightII is saved to files ligfilename_mhplig.surf and ligfilename_mhprec.surf (if this option was requested). Also file ligfilename_mhplig.pdb is provided with ligand molecule which should be loaded in InsightII to read the surfaces. The format of surface file implies that two first lines contain special information. Next lines are of the following format:
x dot coordinate
y dot coordinate
z dot coordinate
color (R,G,B,255)
MHP value
These grids may be used to visualize molecular MHP on any surface in InsightII and MolMol (http://hugin.ethz.ch/wuthrich/software/molmol/) molecular visualizers. The parameters of MHP calculation on grid are:
The output for InsightII is saved to files:
The output for MolMol is saved to files:
When calculations finished there can appear WARNING or ERROR messages on the Results page. WARNING means minor mistakes that can be treated by the program and proceed calculating. ERROR means an unavoidable mistake, making further calculations senseless and require user intervention. Below is given the list of WARNINGs and ERRORs:
WARNING: «CONECT» records will be ignored
«CONECT» records in.pdb files are not processed by PLATINUM; bonds in.pdb and.gro files are defined solely based on distance between atoms; if one wishes to work with complex or nonstandard compounds — it is better to use.mol2 or.sdf file formats where bonds are given explicitly;
WARNING: bad file format; omitting string
.pdb and .gro files have fixed lengths for each field (atom name, coordinates, etc.), if an atom string is too short it cannot be processed and is omitted;, however this warning will likely lead to unavoidable problems in MHP type assignment due to loss of atom(s) and finally to the program termination; inspect the corresponding file manually;
ERROR: bad file format; program terminated
a string corresponding to an atom does not contain enough information about this atom (some data missing); while in case of.pdb or.gro the atom is simply omitted, PLATINUM is less forgiving in case of.mol2 and.sdf since these are more complex molecular formats;
ERROR: bad file format; wrong atom numbering
in .mol2 and .sdf formats bonds are identified by the two numbers of corresponding atoms, so atom numbering is quite important; if some troubles with atom numbering were encountered, program will terminate; inspect the corresponding file manually;
WARNING: atom type column not found; trying to detect atom types automatically
old .pdb file format does not contain the atom element symbol in column 78 (the new format does); this is only a minor mistake, since usually it is straightforward to identify the element type from the atom name (for.gro format it is the default procedure); however be aware of difficulties that arise if atom name starts with characters other than its element type (number is ok):
1H will be identified as Hydrogen;
C8 will be identified as Carbon;
CL8 will be identified as Chlorine;
AC8 (e.g. adenine C8) will be identified as a weird element «A» and omitted;
WARNING: unidentified atom type found; trying to detect atom types automatically
if atom type is given other than a sensible element (e.g. Du dummy atoms, Lp lone pairs, Any any atoms, Het heteroatoms, etc.) which are found in abundance in.mol2 format, then PLATINUM will try to detect atom type automatically as it is done for.gro or.pdb; note that if unsuccessful, PLATINUM will omit this atom; lone pairs are omitted anyway;
WARNING: ignored atom
if the program encounters an atom for which element type cannot be identified or a pseudo-atom (Lp, Du, etc.) it is omitted;
ERROR: file contains no atoms
file likely to be not of the corresponding molecular format, program will terminate; inspect the corresponding file manually;
ERROR: cannot open input file
if you have received such message then there are some problems with our web-server, please tell us so that we could fix the problem;
WARNING: ligand file contains metal atom — will be omitted
only receptor structure can contain a metal ion; if metal ion is necessary for analysis of molecular properties than it should be submitted as part of the receptor molecular file;
WARNING(platinum): MHP TYPE ASSIGNMENT FAILED IGNORED
ERROR(platinum): MHP TYPE ASSIGNMENT FAILED
PLATINUM automatically identifies the valencies of atoms and bond orders and based on these data assignes atomic MHP constants; if it fails to do so for any atom its MHP constant will be set to zero; two ways are possible:
his web-service combines all our best results obtained in the efforts to improve the performance of standard molecular docking packages. It is absolutely free to use for Academia; commercial users must ask for a licence. We hope that PLATINUM will be useful in molecular modeling of interactions of ligands with receptors. Please, use the following reference to cite the software:
Timothy V. Pyrkov, Anton O. Chugunov, Nikolay A. Krylov, Dmitry E. Nolde, Roman G. Efremov. PLATINUM. Laboratory of Biomolecular Modeling at Shemyakin-Ovchinnikov Institute of Bioorganic Chemistry, Russian Academy of Sciencies, Moscow, Russia, 2008. http://model.nmr.ru/platinum.
(Article in preparation)
All questions about PLATINUM can be asked at the net forum or via
The authors will be grateful for any remarks on conceptual issues or suggestions on technical improvements of the service.